


Business: business@xtoolonline.com
Social Media Cooperation: Media@xtoolonline.com
Support: support@xtoolonline.com

A topology map in automotive diagnostics provides a visual overview of a vehicle’s control modules and the communication networks linking them. This feature appears on advanced diagnostic scanners built for full-system and network diagnostics. Its primary goal is to help technicians examine vehicle networks more thoroughly and intuitively. They can locate problematic modules or faulty communication paths and raise both diagnostic speed and accuracy.
Traditional diagnostic workflows require scanning individual systems one after another, referencing wiring diagrams, and manually testing connectors. This process can easily consume hours.This article explains how the XTOOL Topology Mapping function operates. It includes a step-by-step usage guide, common diagnostic use cases, reasons the XTOOL D8W serves as a practical tool, and answers to frequently asked questions.
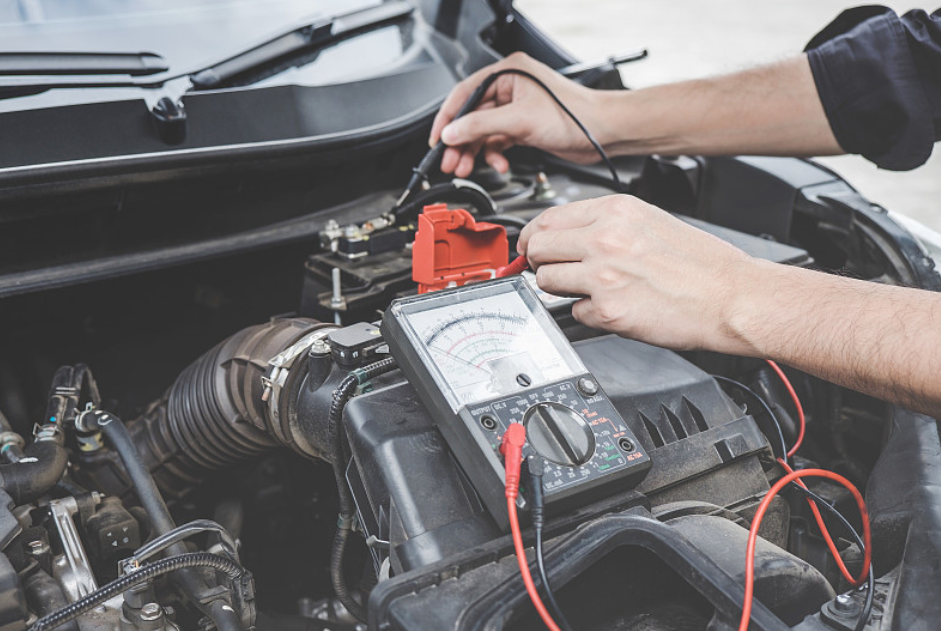
Modern vehicles have many control modules, and EV/hybrid designs bring greater complexity. Communication faults may trigger symptoms across unrelated systems.In a 2018 Malibu,CAN resistance at the DLC read normal, but a rubbed wire near the battery tray created noisy bus signals. A 2019 Civic produced a cluster of safety warnings plus a lean fuel code, turbo underboost and multiple U-codes. Traditional diagnostics force technicians to scan systems one by one and manually test connections. U-codes only tell you which module lost communication, not the root wiring issue. Topology maps solve this by visualizing the whole network, so technicians can rapidly narrow faults down to a subnet, module or connector.
| Aspect | Traditional Communication Fault Diagnosis | Topology Mapping Diagnostics |
| Starting point | Technician starts with codes and symptoms | Technician starts with a full network view |
| What you see | Separate system scans, wiring diagrams, and manual tests | A visual map of modules and communication paths |
| How fault is located | Check modules one by one and test wires or connectors | Look for abnormal modules or broken communication links |
| Time and effort | Can take hours when symptoms span multiple systems | Can reduce the search area quickly |
| Reliance on experience / Suitable audience | High, since the technician must guess where to begin. Best for experienced techs who already know common failure points on specific models. | Lower, since the map shows where to focus. Suitable for less experienced technicians, DIY owners, and anyone who wants a clear visual guide instead of relying on memory or guesswork. |
| Scope of diagnosis | Often starts with the whole vehicle | Narrows to a subnet, module, or connector |
| Risk of misdiagnosis | Higher when U-codes only show lost communication | Lower when the network path is visible |
| Best use | Simple faults or when a topology map is not available | Multiple U-codes, CAN faults, EV network faults, and intermittent communication loss |
This section focuses on how XTOOL implements this feature and what it offers in daily diagnostic work.
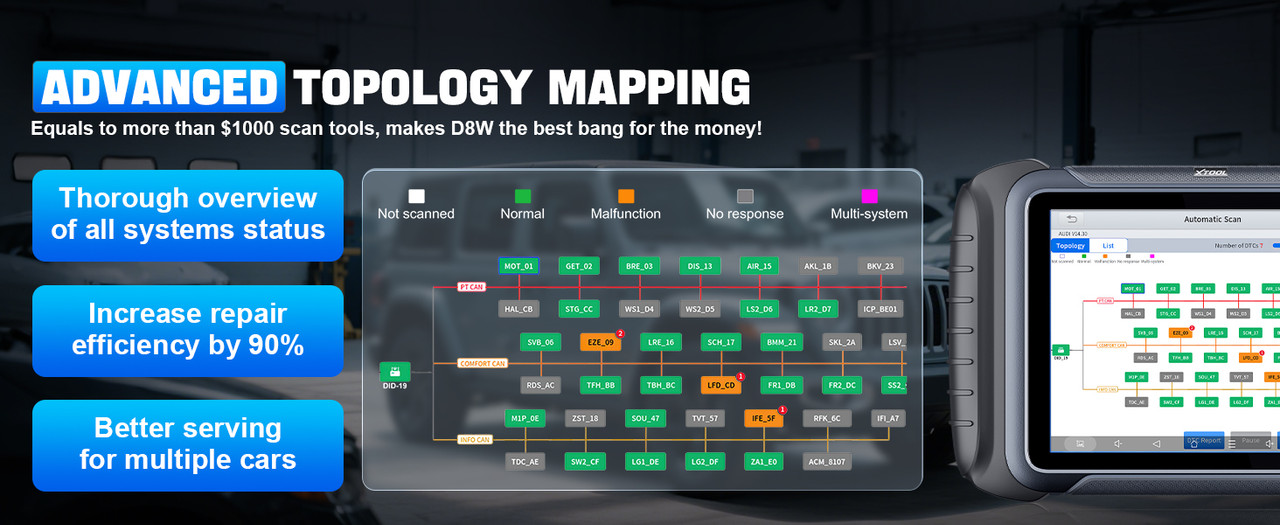
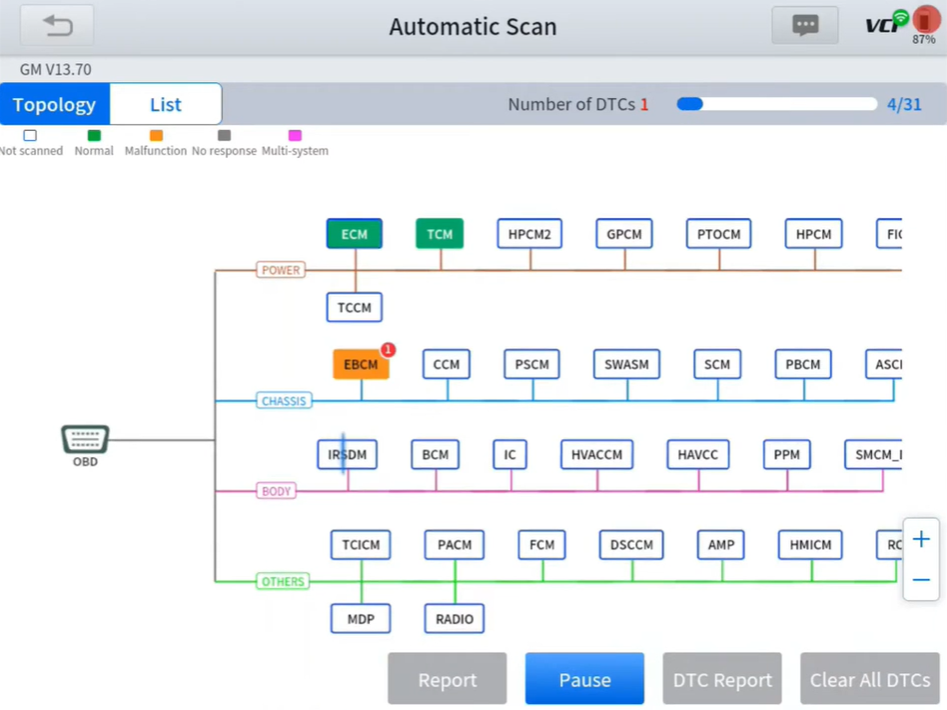
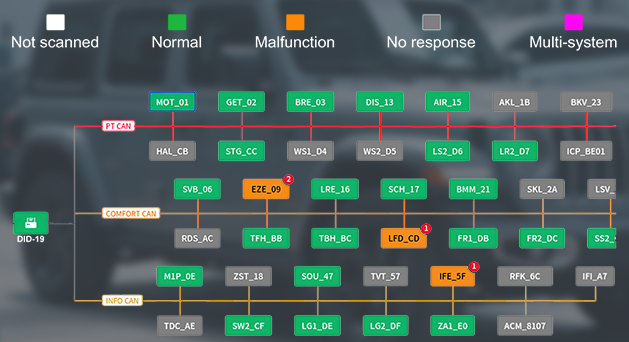
After connecting the tool to the vehicle, XTOOL runs an automatic full system scan. It then displays control modules within a tree style or network diagram. Each module carries a dedicated color code to indicate its diagnostic status:
White: Not scanned
Green: Normal communication, no detected faults
Orange: Malfunction, fault codes present in the module
Gray: No response, loss of communication with the module
Purple: Multi system related module
This color coding lets users quickly spot problem areas without scrolling through long lists of trouble codes first.
The scan itself is fast. XTOOL reports that system scanning speed can be improved by up to 60 percent compared to traditional step by step scanning. You can also switch freely between topology mode and list mode. Topology mode delivers the visual network overview. List mode shows the conventional module list for detailed inspection.
The advantages are practical and direct:
Instead of checking modules one by one, you get a global view of the network. This helps you avoid overlooking hidden faults that do not trigger obvious DTCs.
The map helps you identify the root module or broken communication path, not just surface level fault codes. A U code may report which module has stopped communicating, but the topology map visualizes exactly where the communication link fails.
According to real world feedback, CAN bus communication faults that once took roughly two hours to diagnose can be finished in around ten minutes using topology mapping. Less time is spent on guesswork, and more time is spent testing the correct area.
A clear visual of network structure reduces misjudgment of fault locations. You can observe module interconnections and see exactly where signal paths break down.
The topology map delivers the highest value under these conditions:
1.Multiple systems log fault codes simultaneously, and you need to locate a common root source quickly.
2.You are troubleshooting CAN bus communication failures.
3.You service EV or hybrid vehicles with complex multi module communication architectures.
4.You need to track down intermittent communication faults that cannot be reproduced consistently.
5.In these scenarios, the visual network view saves significant time and reduces over reliance on pure technician experience or guesswork.
Plug the XTOOL scanner into the vehicle’s OBD-II port. Select the vehicle make, model and year, then launch the automatic full-system scan.
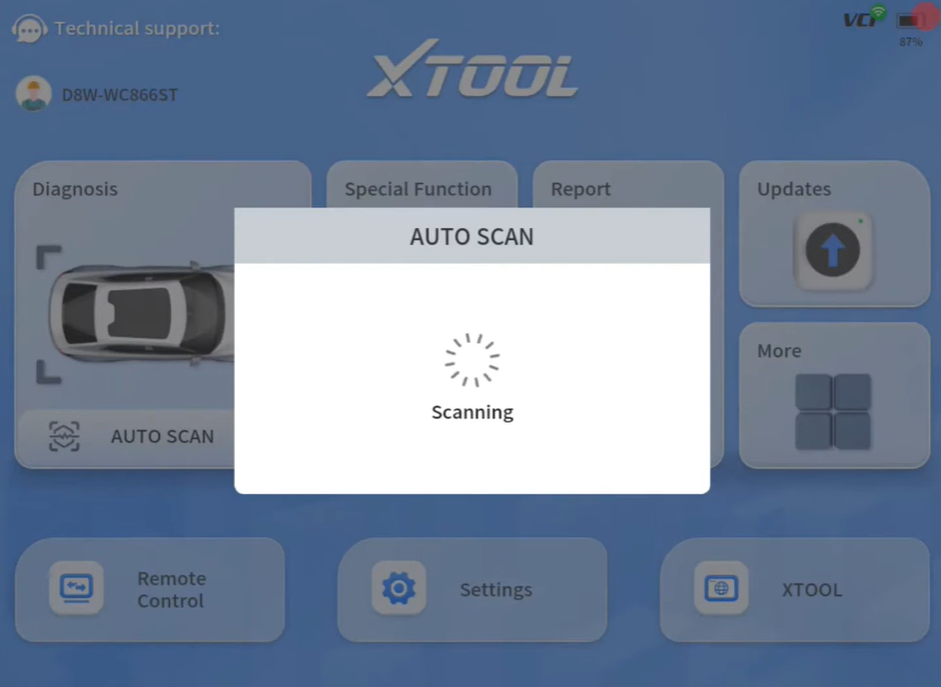
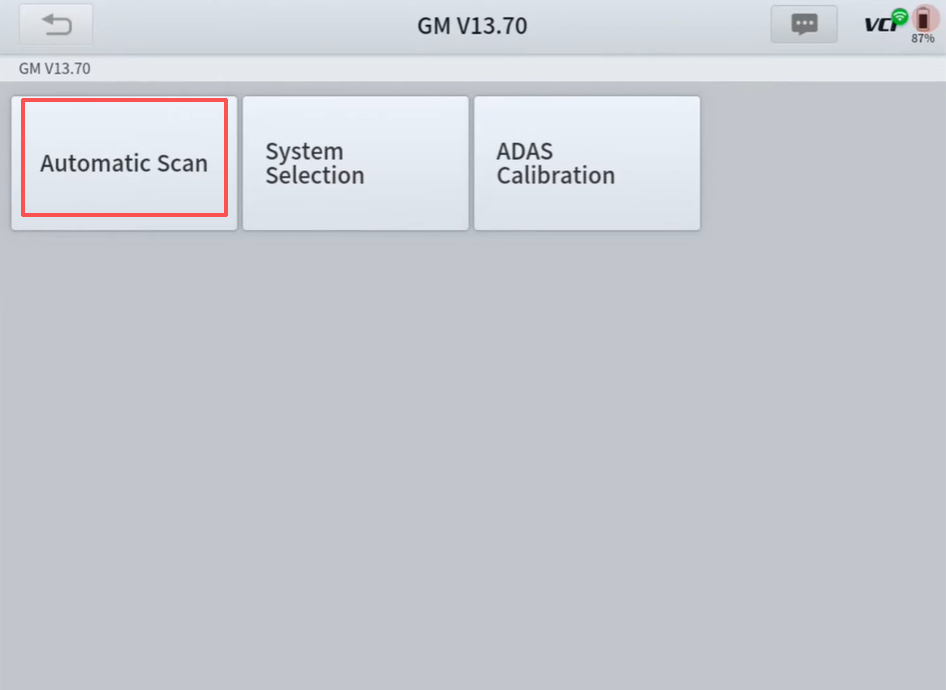
As scanning proceeds, the map appears on screen. Control modules show as nodes, connected by communication lines. The diagram updates continuously, with each module color-coded to show its status.
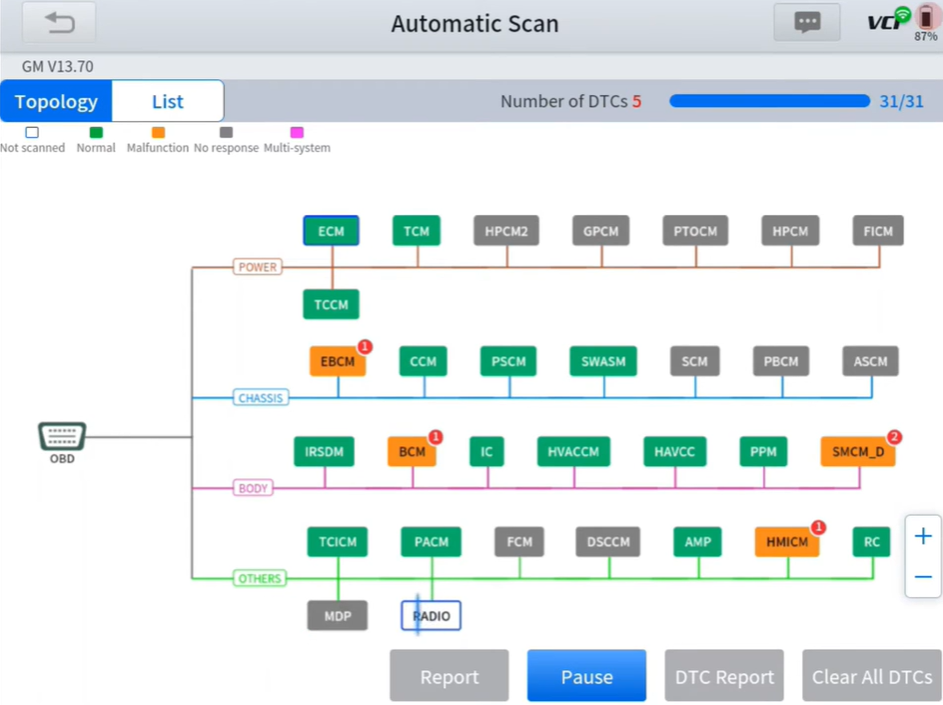
Five colors mark module conditions:
You can quickly tell healthy modules apart from problematic ones at a glance.
Tap the icon of any abnormal module. The tool opens its dedicated menu, where you can read DTCs, view live data and run active tests.
Check the module’s network connection. If only this module fails while others on the same path work, the fault is likely within the module. If multiple modules drop out together, the issue usually lies in wiring or the main communication link.
After repairs, run another full scan. Compare the new topology map to the original. Modules previously orange or grey should turn green, confirming the fix.
This workflow streamlines complex network diagnosis. Rather than scanning systems one by one and guessing where to start, technicians see the whole network instantly and focus testing on the right area.
To apply the topology map workflow in daily work, you need a scan tool that supports OE-level module mapping, fast scanning, and modern protocols. The XTOOL D8W is built for this type of diagnosis. It offers a visual network view, wireless freedom, and broad vehicle coverage without a flagship price tag.
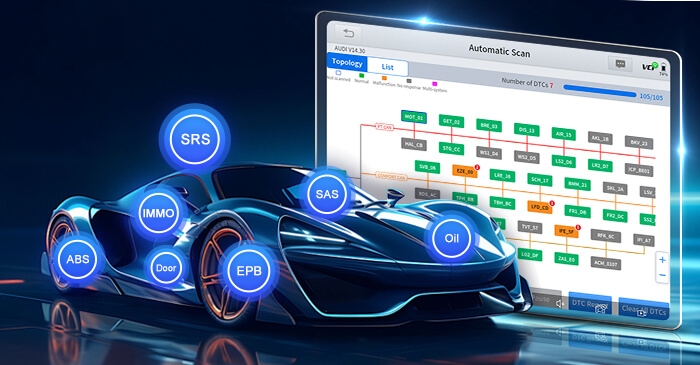
The D8W supports OE-level topology module mapping. It shows the vehicle module network in a visual layout, so you can locate faulty or disconnected components quickly. This is the core feature discussed in this article.
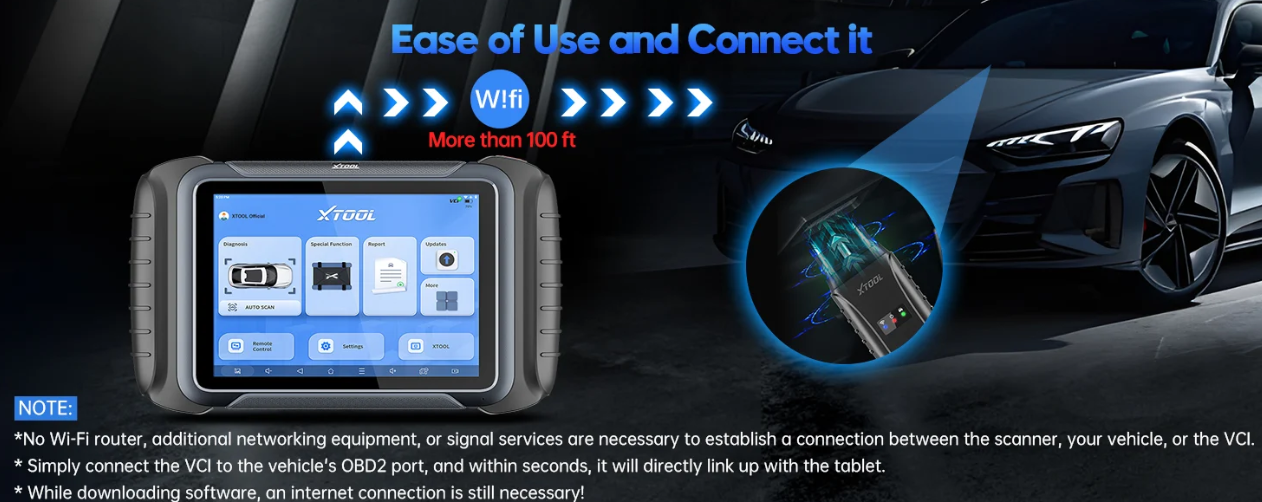
The tool connects over built-in WiFi instead of Bluetooth. The range reaches up to 66 feet, so you can move between the driver’s seat and the engine bay while keeping a stable connection. A wired mode is also available.
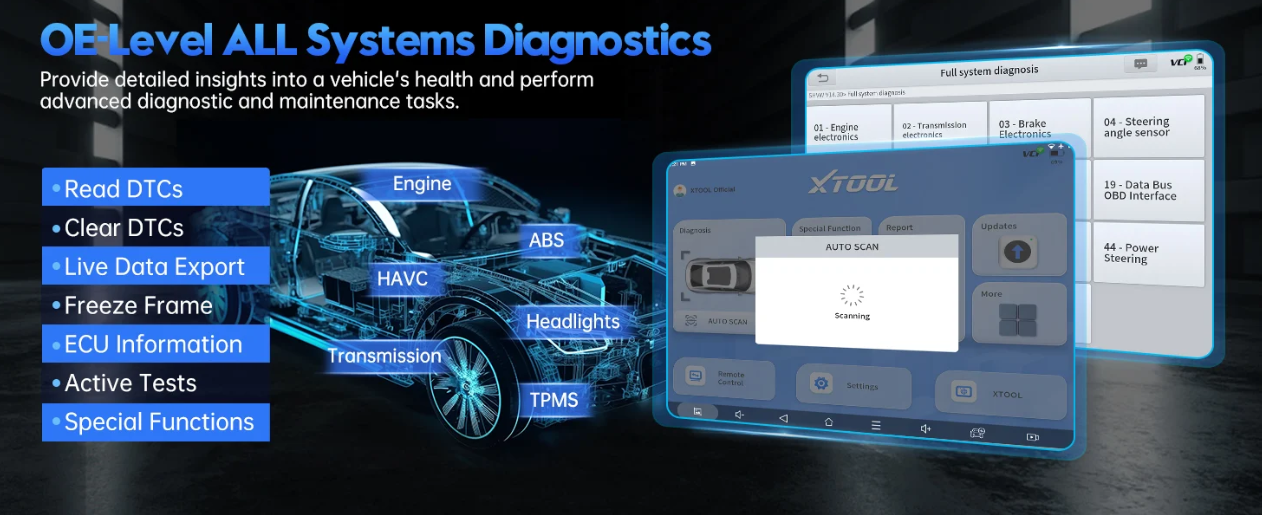
The D8W scans engine, transmission, ABS, SRS, TPMS, BCM, body, HVAC, and more. It includes 42 or more maintenance services such as throttle relearn, ABS bleeding, injector coding, and transmission reset.
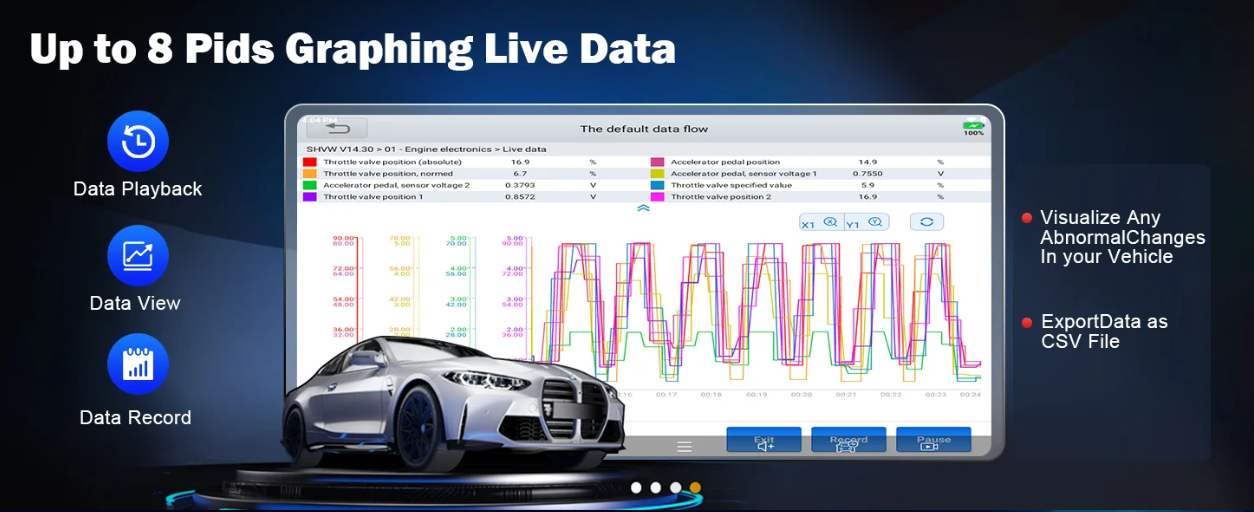
Bi-directional control supports more than 4000 active tests. You can command ECUs to activate components like EVAP systems, A/C clutches, and fuel injectors. The 8-in-1 live data graphing function lets you view up to eight parameters at once, with playback and CSV export.
The D8W supports CAN FD, DOIP, and FCA AutoAuth. This means the topology mapping function works on newer BMW, Benz, and other DoIP-equipped models. Software updates are free for three years over WiFi.
Topology mapping replaces long lists of trouble codes with a clear visual layout of the vehicle network. As the scan runs, modules and communication links populate the screen with color-coded status markers. This lets technicians quickly isolate network faults down to a module, subnet or connector. The XTOOL D8W enables this streamlined workflow with OE-level topology mapping, wireless diagnostics, full-system coverage and modern protocol compatibility. For repair shops and technicians seeking a more visual, efficient method to troubleshoot communication faults, the D8W is a solid practical option.


Business: business@xtoolonline.com
Social Media Cooperation: Media@xtoolonline.com
Support: support@xtoolonline.com